OEMs

Turn machine data into better service execution.

Detect earlier. Prioritize correctly. Execute at scale.

Dashboard titled 'My uptime dashboard' showing uptime at 90%, utilization at 84.6%, operating time of 900 hours, and a fault code table listing errors with severity labeled as Error.

Machine data is not the problem. Execution is.

Dashboard interface displaying fault count, operating time, utilization percentage, fuel consumption, machine utilization and error statistics with charts and fault list.

Most OEMs already have machine data.
But performance still breaks between signal, diagnosis, and action.

  • Signals are fragmented across systems.
  • Service teams chase low-value alerts.
  • No consistent link between detection and action.

From data to measurable outcomes

Measured across real fleets and service operations.

-25%

Warranty claims

Earlier detection reduces unnecessary exposure.

+35%

Aftermarket Revenue

New service and parts opportunities from machine data.

+40%

Service Efficiency

Better prioritization and dealer alignment.

+30%

First-Time Fix Rate

Better diagnosis before dispatch.


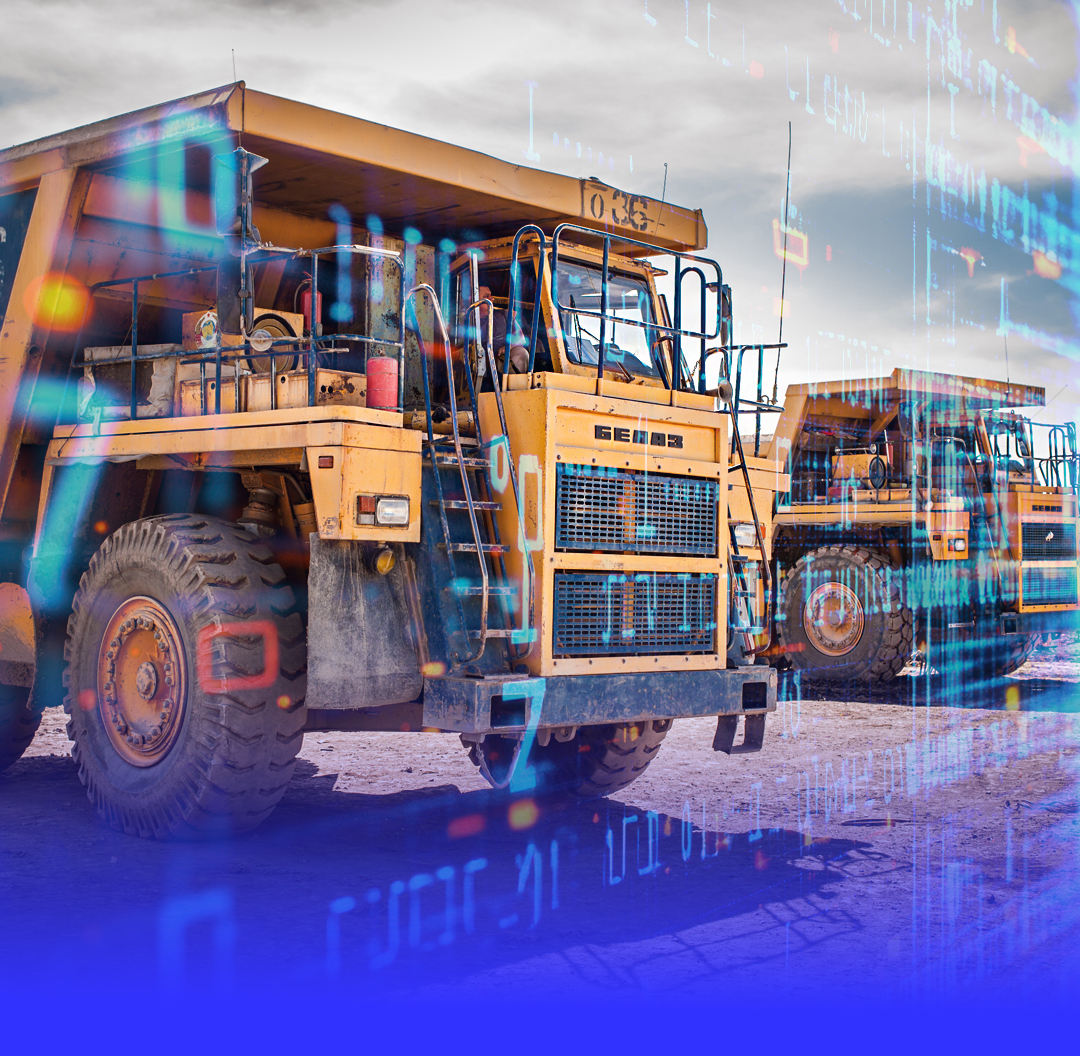
Your machines work every day. Your data should too.

TALPA turns sensor and telemetry data into service intelligence.
Your aftermarket team turns that into revenue.

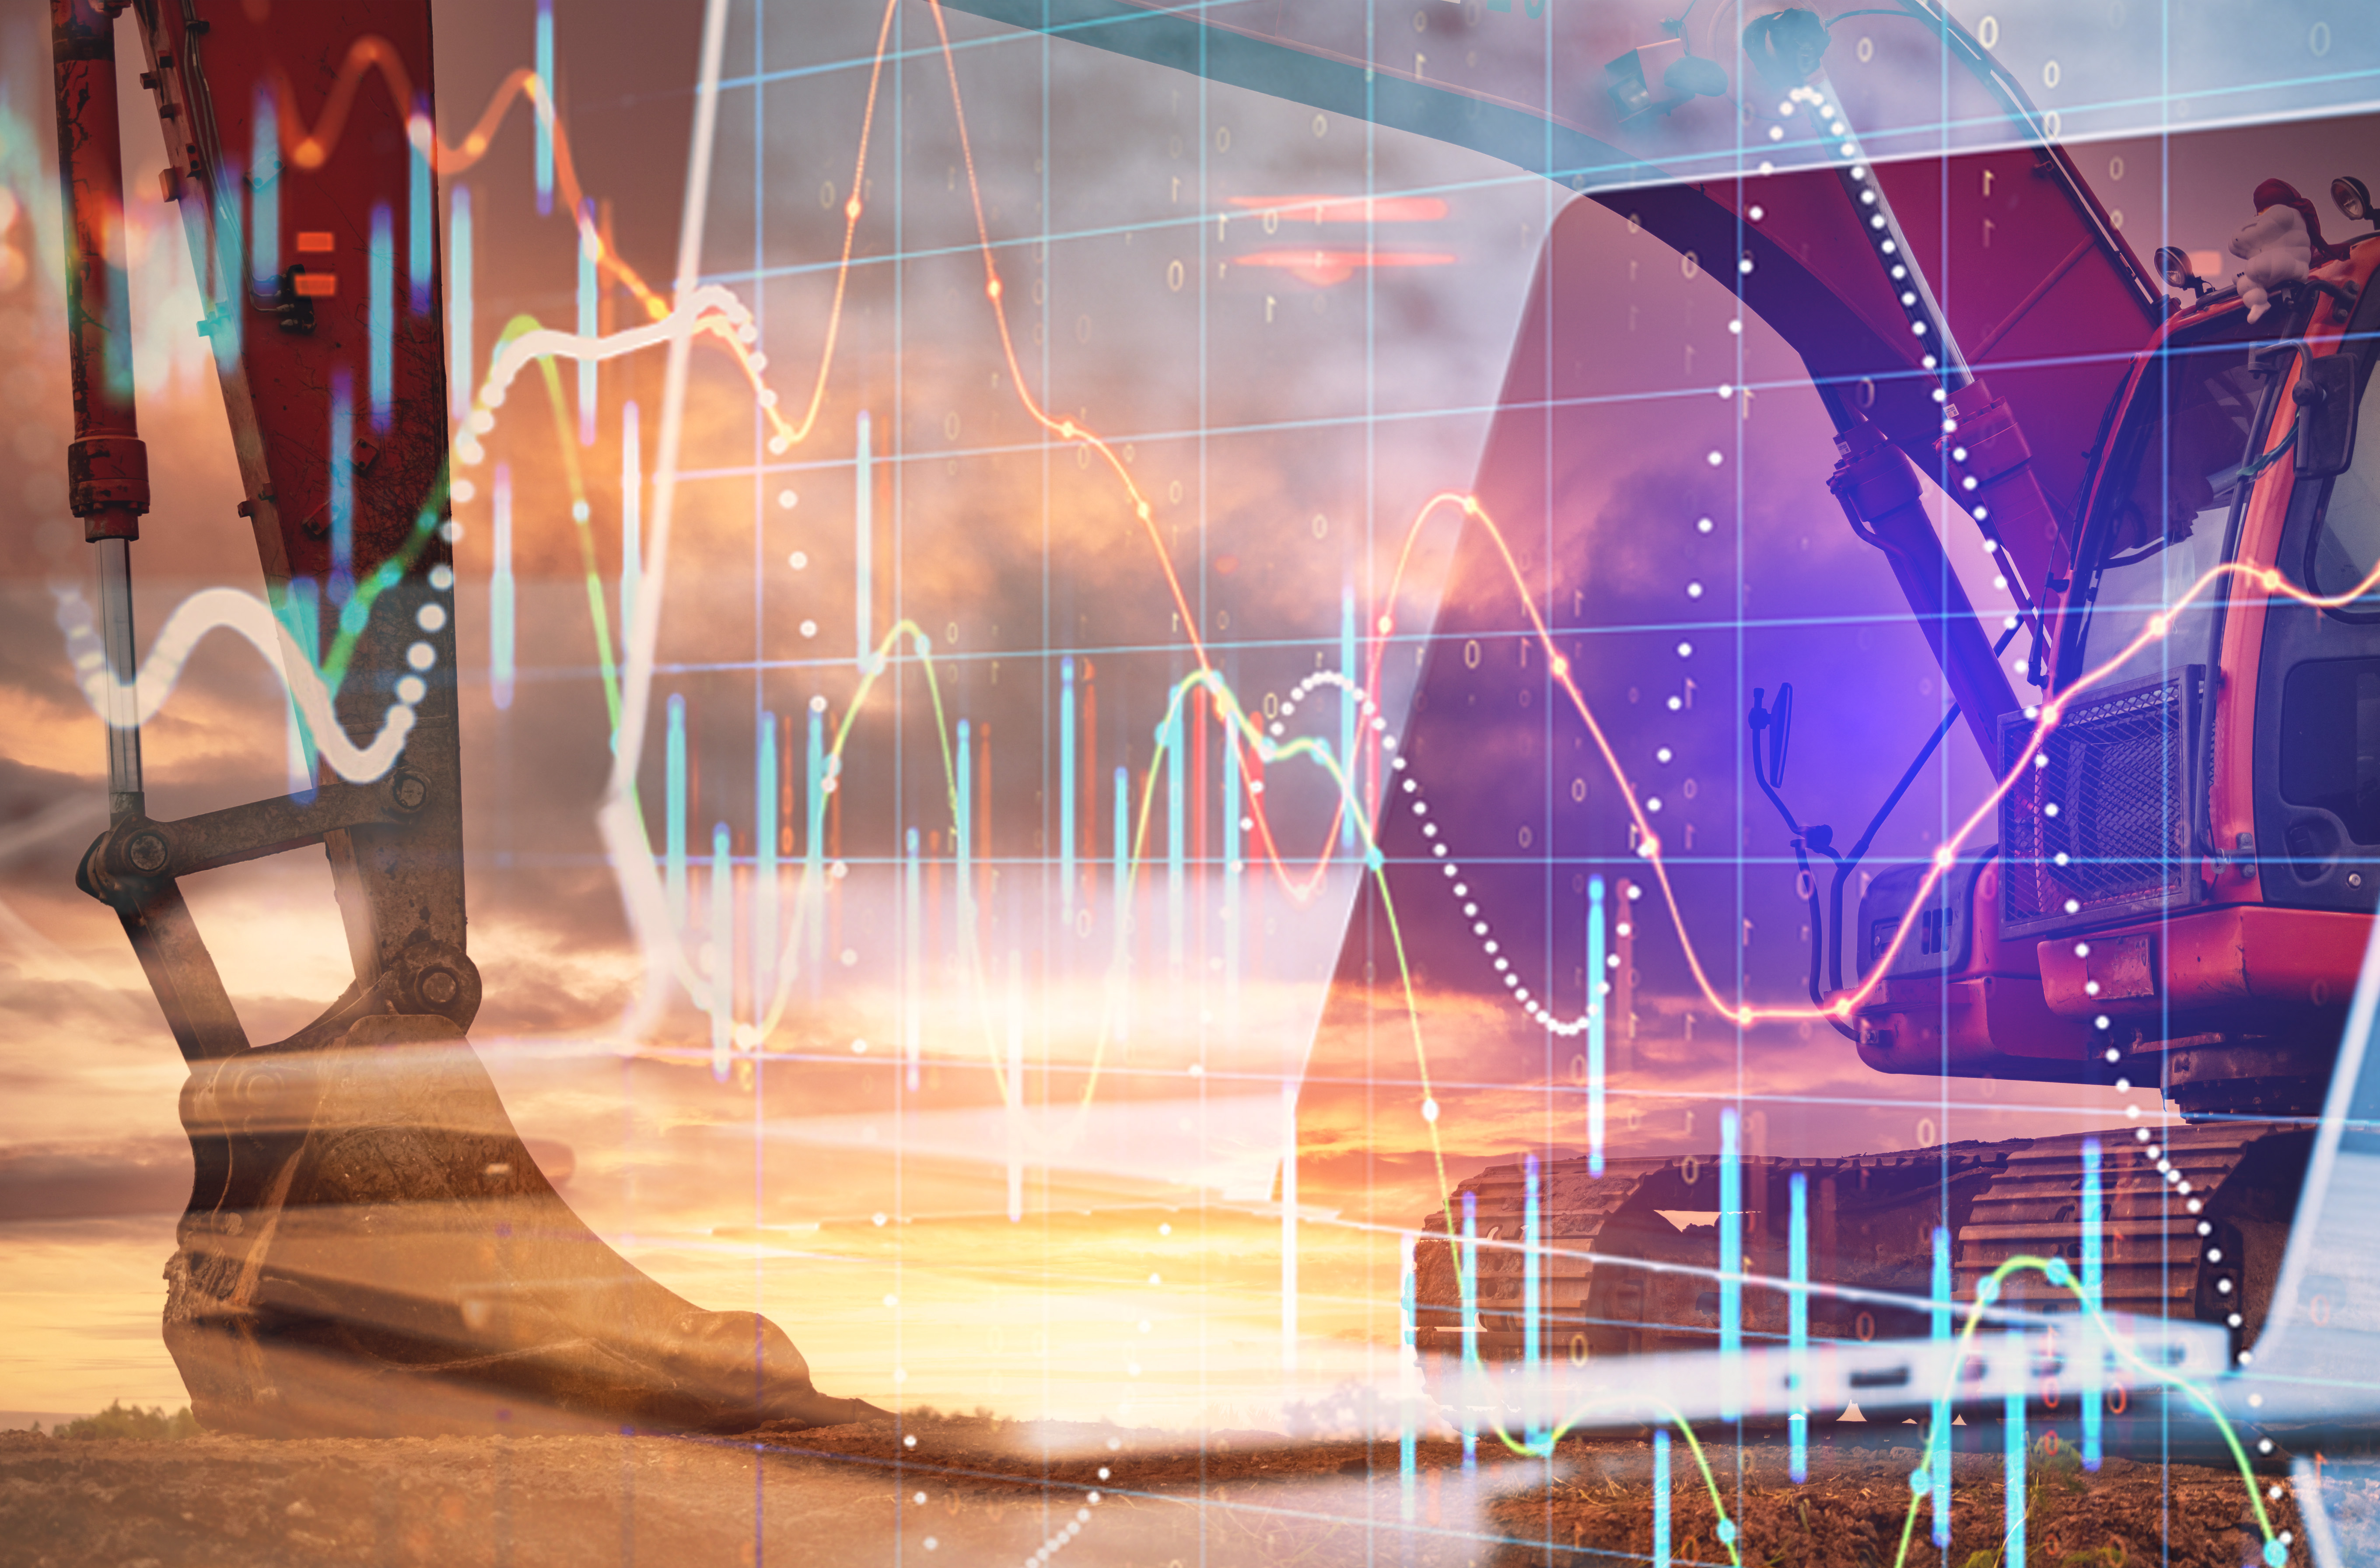
Turn machine data into service actions that drive real results.
From reactive repairs to scalable service models
Stay ahead of critical machine issues in the field
Bearded man in a yellow hardhat and work jacket looking down with a serious expression in an industrial setting.

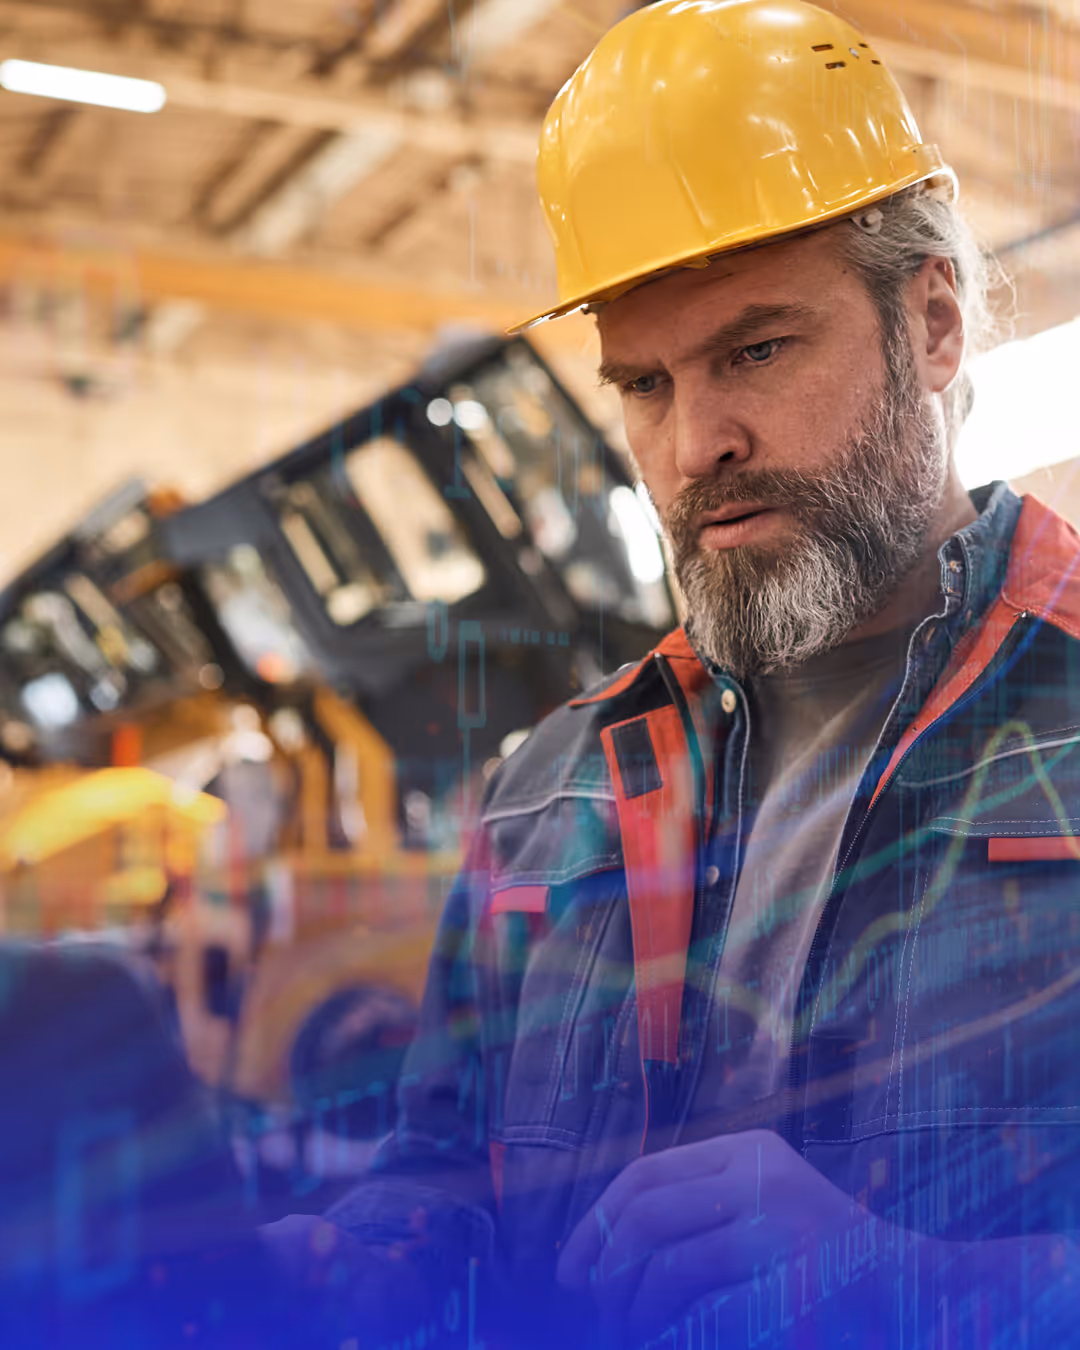
Turn your installed base into revenue.

Talk to a TALPA OEM specialist and identify your aftermarket potential in one structured session.
Close-up of a hand interacting with a tablet displaying an uptime dashboard with charts and performance metrics.
Thanks for joining our newsletter.
Oops! Something went wrong.

Trusted by leading OEMs.

“When I saw how they handled data I was impressed and surprised what is possible with our data. We moved from being a reactive OEM to a proactive one, thanks to TALPA"

Thomas Sandrock
Director Product Support & Quality

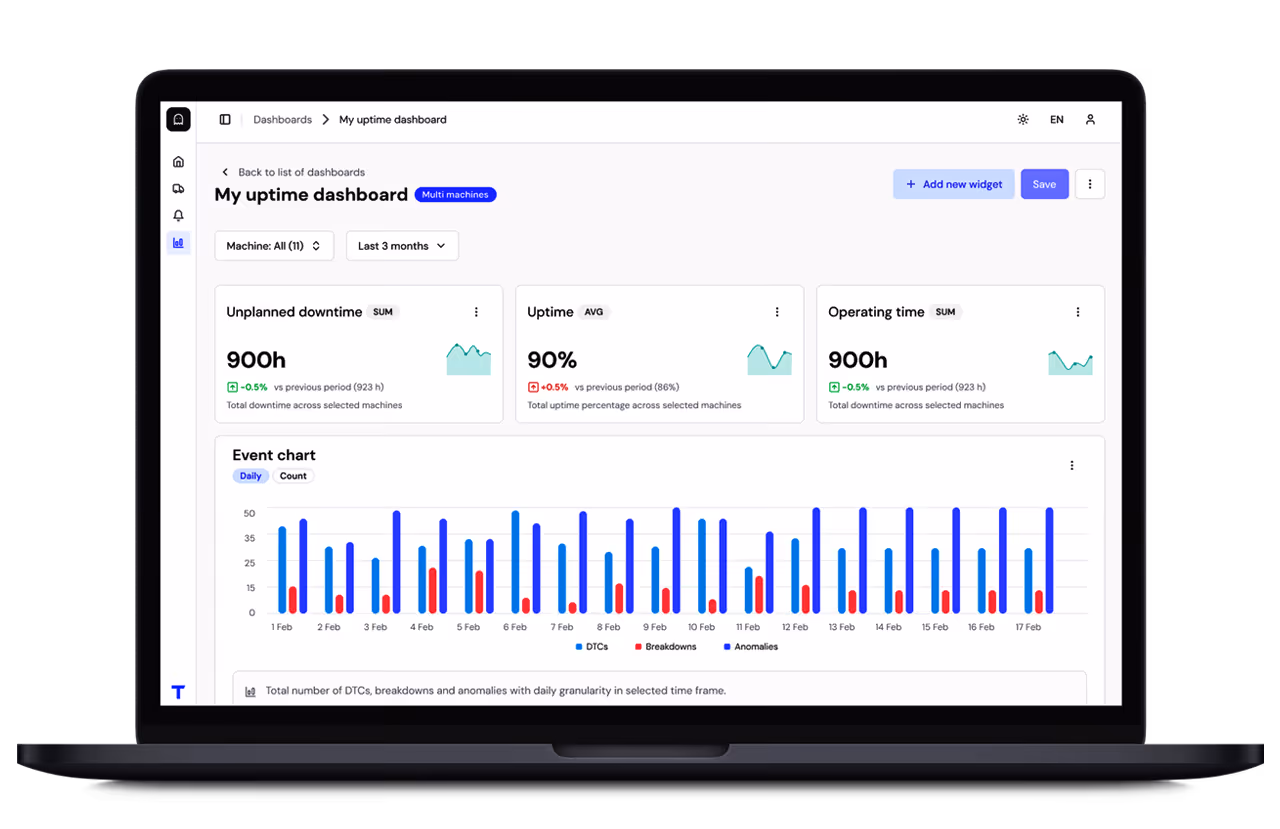
How OEMs use TALPA in practice.

Glowing bright pink and purple wave of light with intertwining lines on a dark background.

DETECT

Surface critical machine issues across your fleet — early and continuously.
Aggregate signals across machines, systems, and generations into one unified view.

Glowing neon wave in blue and pink hues on a dark background, resembling a soundwave or light wave.

DECIDE

Prioritize what matters and define the right action for each case.

Filter noise, identify root causes, and create clear, actionable service cases.

Bright blue and pink light beams converging and radiating outward on a dark background.

ACT

Execute faster across service teams and dealer networks.

Route cases, support diagnosis, and ensure consistent execution at scale.

Three steps from first conversation
to live aftermarket business.

Laptop screen showing a multi-machine uptime dashboard with metrics for unplanned downtime, uptime percentage, operating time, and a daily event chart of DTCs, breakdowns, and anomalies for February.

TALPA provides a single, open platform to unify asset data across models, generations, and systems. Integrate once and scale across your portfolio to enable digital services that improve uptime, support customers, and unlock new revenue streams. Designed to work with existing connectivity and OEM architectures, TALPA helps you turn your machine data into long-term product and business value.

Start

We connect your existing machines, and validate the commercial opportunity together in less than 3 months, with an agreed number of pilot machines.

Curved blue and purple dashed arrow pointing downward.Blue dashed curved arrow pointing up and to the right.

Build

We set up and deploy your tailored platform - users, fleets, sites, events, notifications, integrations, workflows, shaped around your aftermarket model.

Blue dashed curved arrow splitting into two directions and then joining again, pointing downward on black background.Blue dashed arrow pointing to the right with a curved tail on a white background.

Grow

 Choose the commercial model that fits your business needs: per-machine subscription, hardware bundle, or revenue share, which can evolve as your services scale.